Skip to content

Alexandru Cernat

Menu
  • Home
  • Research
    • Publications
    • Presentations
    • Grants
  • Teaching
  • Consulting
  • Blog
  • Contact

Category: Longitudinal data

documents on wooden surface
Longitudinal data / R

Data structures for longitudinal analysis: wide versus long

Learn how to create, store and reshape longitudinal data. Moving from wide to long data format and back using R.

Longitudinal data / R

Explaining change in time using multilevel models and time constant predictors

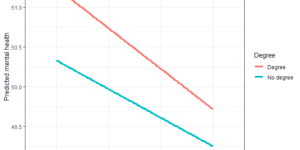
Learn how to explain change in time using time constant predictors using the multilevel model. Examples with real data and R code

example of non-linear change with multilevel model
Longitudinal data / R

Estimating non-linear change in time using the multilevel model for change

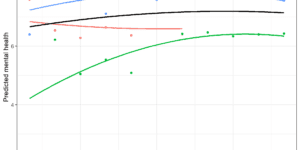
Learn how to model non-linear change in time using the multilevel model for change in R. Hands on tutorial with real data.

Longitudinal data / R / Statistics

Understanding causal direction using the cross-lagged model

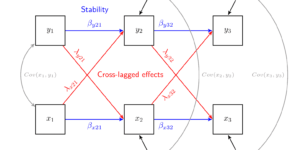
Learn how to investigate the causal direction of two variables using the cross-lagged model and longitudinal data.

Longitudinal data / R / Statistics

Estimating change in time. Comparing the multilevel model for change with the Latent Growth Model

Learn how the multilevel model for change and the latent growth models are different and when to use each one.

Comparing estimates of change for Latent Growth Models with non-linear effects
Longitudinal data / R / Statistics / Visualization

Estimating non-linear change with Latent Growth Models in R

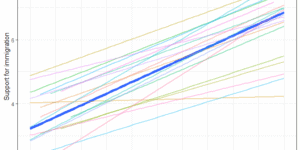
Learn how to estimate and visualize nonlinear Latent Growth Models (LGM) using R and real world longitudinal data

individual level change
#freesurveydata / Longitudinal data / R / Statistics / Teaching / Visualization

Estimating multilevel models for change in R

Learn how to analyze longitudinal data using multilevel model for change with R. Real world data and syntax.

Longitudinal data / R / Statistics / Teaching / Visualization

Estimating and visualizing change in time using Latent Growth Models with R

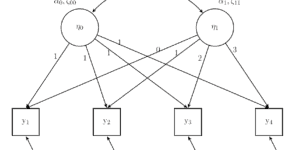
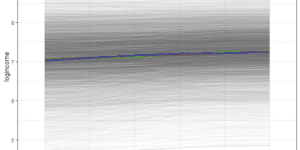
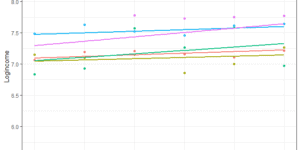
Tutorial showying you how to visualize change in time and how to estimate it using Latent Growth Modeling wirh R.

Search

Recent Posts

  • Understanding the Measurement Quality in Smartphone Usage: Surveys vs. Digital Trace Data
  • Data structures for longitudinal analysis: wide versus long
  • Interview for Frontmatter podcast discussing survey research and longitudinal data analysis
  • Explaining change in time using multilevel models and time constant predictors
  • Estimating non-linear change in time using the multilevel model for change

Archives

  • May 2024
  • January 2024
  • August 2023
  • April 2023
  • February 2023
  • December 2022
  • November 2022
  • April 2022
  • March 2022
  • February 2022
  • December 2021
  • November 2021
  • September 2021
  • July 2021
  • May 2021
  • April 2021
  • March 2021
  • February 2021
  • January 2021
  • November 2020
  • October 2020
  • May 2020
  • April 2020
  • March 2020
  • February 2020
  • September 2019
  • August 2019
  • June 2019
  • May 2019
  • April 2019
  • March 2019
  • February 2019
  • January 2019
  • December 2018

Categories

Tags

#freesurveydata admin data conference confidentiality course courses cross-cultural research cross-national research data data quality data science digital trace data equivalence europea social survey events experiment factor analysis herachical models interview lme4 longitudinal data measurement measurement error mixed modes mobile apps mobile survey multilevel model multilevel models nested data news non-probaiblity surveys non-response paper privacy programming R Royal Statistical Society sensors special issue statistics summer school survey methods teaching visualization web surveys
Join Newsletter
Keep Updated
Copyright © 2025 Alexandru Cernat – OnePress theme by FameThemes
Privacy & Cookies: This site uses cookies. By continuing to use this website, you agree to their use.
To find out more, including how to control cookies, see here: Cookie Policy